
Scope: June 2015 – May 2020
A couple of weeks ago, on Steve Smith’s birthday, a few friends of mine were debating our lists of top five test batsmen in the world. While Steve Smith and Kohli were almost unanimously on top of everyone’s list, the remaining 3 spots had multiple contenders. I, for one, felt Dimuth Karunaratne was underrated and definitely deserved a spot in the top five, several others felt that Babar Azam definitely belonged there. Joe Root’s spot was hotly contested given his lack of big hundreds while Kane Williamson, Dave Warner Quinton De Kock, Pujara and Ben Stokes were some of the other names discussed.
With the lockdown nearing 100 days, I decided to put the extra time in to doing something completely pointless – a statistical analysis of the top names discussed to come to a final conclusion. Was Steve Smith really the best? Does Joe Root’s consistency in getting 50s put him in this list or his inconsistencies in getting 100s make him a lesser player?
I took the sample from the various players that were discussed, and I added along a couple of names who I thought did well, but do the job silently.
The first eight names I ended up with were Smith, Kohli, Root, Williamson, Azam, De Kock, Karunaratne and Rahim – easily the best batsmen from their respective countries. To this, I added Pujara (brilliant at home, was magnificent in Australia), Ben Stokes (dream Ashes and a 250 in South Africa), Tom Latham (has two hundreds in 3 different countries) and Dave Warner (poor Ashes, but remarkable at home). I also remembered Ross Taylor’s 290 in Australia and considered a third Kiwi in my sample.
The time period in consideration was going to be June 2015 – May 2020.
Here’s a first look at how these players fared during this period.
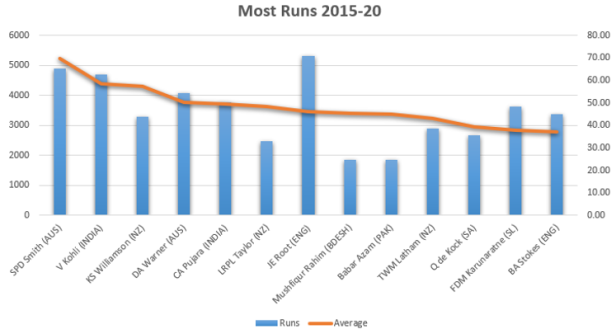
Root was the only one to have over 5000 runs, but had played 41 innings more than Smith and 35 innings more than Kohli and Warner, who were next highest (in that order). However, Smith averaged 69.90, a full 10 average points more than Virat Kohli. Williamson and Warner were the only other batsmen averaging over 50.
However, for the sake of this analysis, I wanted to consider the runs scored in tougher conditions, and away from home as factors, before arriving at a conclusion.
For this, I took the SENA countries (South Africa, New Zealand, England and Australia), and India and Sri Lanka as the toughest places to score in. The next step would be to calculate the deviation of the batsmen’s average compared to the average of the top 50 batsmen to have played in that country in the same time period.
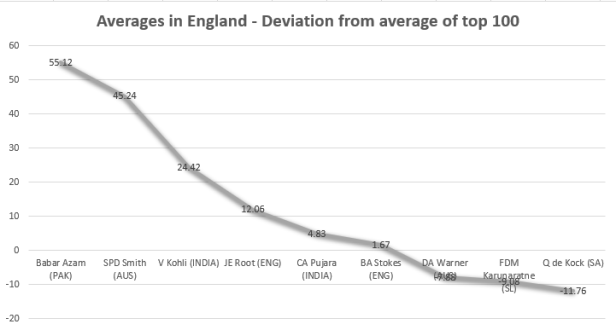
In England, Smith averaged over 80 while Kohli averaged nearly 60. The average of the top 100 batsmen in England during this period was 34.88, thus giving Smith a deviation of +55. Joe Root was above average (as expected!), while Warner (expected again!) and De Kock had negative deviations (below average). Babar Azam was unbeaten at 68 in his only knock in England, and we decided to give him an average of 10 points over Smith for the sake of calculation.
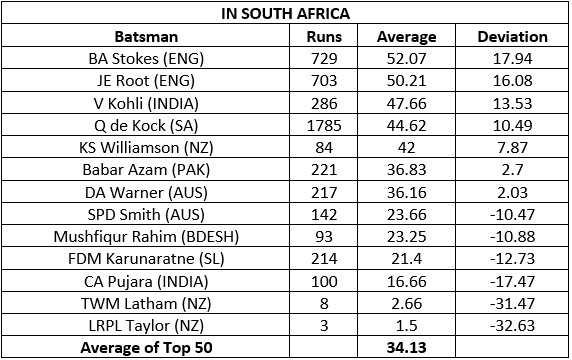
Similarly, I plotted the deviation of averages of these batsmen when compared to the top 50 in those countries.
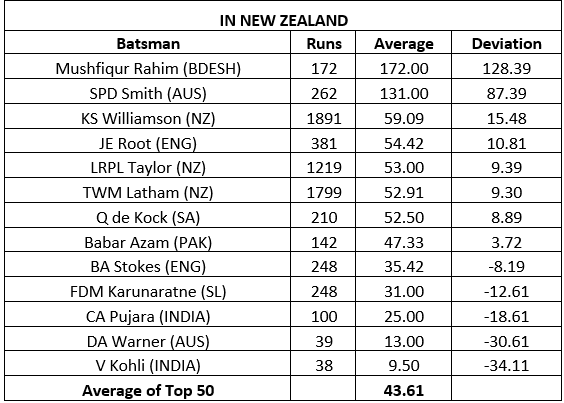
In South Africa, Ben Stokes (huge 200), and Joe Root led the charts while Steve Smith and Pujara were below averages. In New Zealand, Mushfiqur Rahim averaged 172 and Smith averaged 131. Amongst the others, Williamson and Root topped the charts while Kohli was bottom courtesy the tour earlier this year.
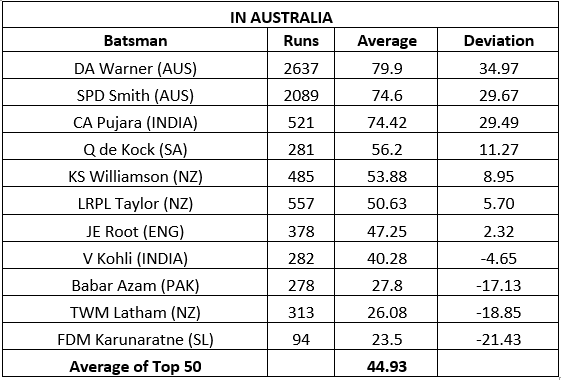
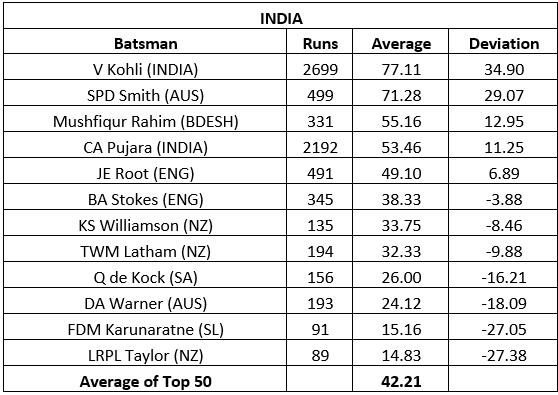
In Australia, Warner, Smith and Pujara averaged over 70 while Kohli was below average. In India, unsurprisingly, Kohli led the charts with Smith trailing. Rahim and Pujara had averages over 50 while the other half of the sample were below average.
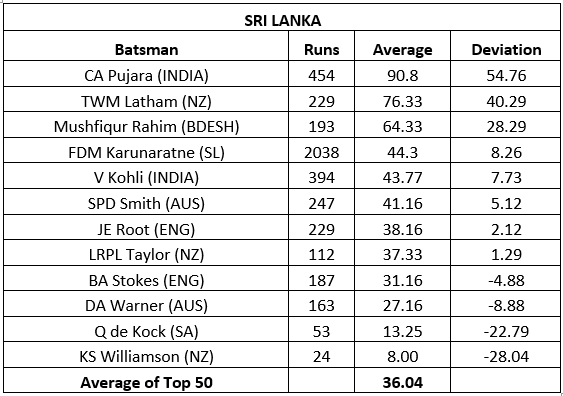
Sri Lanka, always a tough place to visit given the turning tracks and the humid weather had a top 100 average of 36 (slightly over SA and England). Pujara topped the charts here along with Latham (underrated!) and Rahim (again!)
The next few factors I wanted to include are
- more weightage to the runs scored in tougher conditions, and
- more weightage for runs scored away from home
- More weightage to the runs scored in tougher conditions:
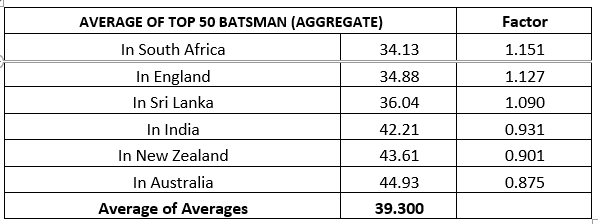
To get the weights, I compared the averages of the top 50 batsmen to have scored runs in these countries. By now, it’s pretty obvious that it’s tougher to score runs in England and South Africa when compared to Australia or India. Hence, the weight factor was decided as the average of scores of the top 50 batsmen in all countries divided by averages of the top 50 batsmen in that country. For example, South Africa gets a weight factor of 39.30/34.13 = 1.151, i.e., an average run scored in South Africa is 1.15 times more valuable while a run scored in Australia is worth only 0.875.
2. More weightage to the runs scored in foreign conditions:
The easiest way to do this was to reduce the weightage of home runs scored. Now the factor to decide this was a tougher choice. I contemplated taking it as 0.6x, but it seemed too harsh. The logic of that being a player plays more games at home, and it is not fair to discount his high average. For example, Warner averaging 79 in Australia over several games deserves equal weightage as, say, Pujara averaging 70 over a lot fewer games.
On the other hand, 0.9x seemed way too high and in the above example, we wouldn’t be crediting Pujara averaging 70 in Australia as much.
Another factor was that someone like Quinton De Kock would play more games in tougher conditions, although home conditions. On the other side of the coin, Warner and Smith would be playing more home games, which means more batting friendly conditions.
So, it was determined to determine the top 10 averages of away batsmen in that country and divide it by the top 10 averages of home batsman in that country to get a weight. Some interesting results ensued.

The top 10 away batsman in Australia averaged only 47.326 while the top 10 home batsmen averaged over 60. Hence, it was only fair that the weight be standardized to 0.776 for home batsmen.
Now, in tougher conditions, say, England – Root bats in more innings in England which, although home are tough conditions, and hence should be given a slightly higher weightage (1.361 from the table above).
CONCLUSION
Now, the last step was to get the average coefficient for each player in each country. This would be the product of deviation from the averages and the scoring factor. So, for example, Smith’s deviation from the regular average in England * scoring factor for England. i.e., 45.24*1.127 = 50.973.
For Joe Root, this number would be further reduced/increased due to home ground conditions. So, for Root, the coefficient would be the product of deviation from regular average (12.06), scoring factor for England (1.127) and the higher matches in tougher conditions (1.361) which would equal to 18.494.
In the end, I took the median of these coefficients to arrive at my final conclusion.
Why median? To rid the data of all anomalies like extremely high averages in one country (remember I didn’t use a minimum number of tests for determining this data), and averages like 0 (ex: Williamson not playing in England).
Essentially, the results are sorted in a way where the average of the third and fourth best countries you play in determine your greatness. This, in my opinion, is a fair way of determining it because you’re not being judged on not how you play in similar conditions, but a more holistic view.
The table for all the players in all countries would like this:
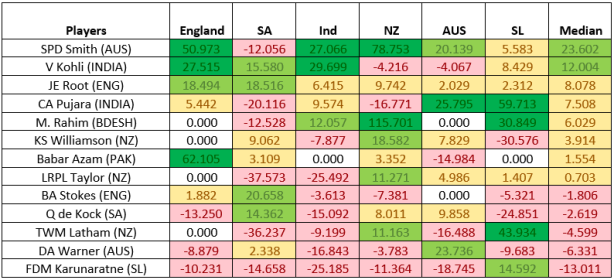
![]()
*Drumrolls*
No surprises as Smith emerges as a clear cut winner as the world’s best Test batsman! His numbers are top notch at home, in England, in Australia, in New Zealand and in the sub-continent conditions in India, thus deservingly giving him the top spot despite not so great results in SA and SL.
Kohli came in second, thanks to high averages at home and in England (fortunate that the 2014 series wasn’t in scope!). So despite the underwhelming numbers in NZ and Australia, he manages to come second.
Root, unsurprisingly came in third with above average numbers in all countries he’s played in – a true mark of consistency. But, still not the best because of no overwhelming numbers in any country!
While, the first three in the list were expected, Pujara came in fourth. Pujara has always been strong in home conditions, and also in the dusty bowls of Sri Lanka. However, his showing in Australia and England tours clinched this spot despite having terrible tours of SA and NZ.
The fifth name on the list was a real surprise, and though I must say deserving! Mushfiqur Rahim scored 172 in his only test in NZ, while averaging over 55 in both SL and India. He’s yet to play in England and Australia – and who’s to say he won’t do well, if he gets an opportunity!
Williamson didn’t play on the seaming tracks in England during this period but due to poor averages in the sub-continent, he missed the top 5. Azam didn’t play a single game in SL during this period, and his numbers will only improve when he gets the chance. It is interesting to see Warner so low in the table, despite being Australia’s best batsman at home during this period, and that is rightly so because he ended up being below average in England, India, SL and NZ!
My pick, Karunaratne, was definitely most hyped as he was above average only in home conditions, but I sure hope to be forgiven for trying to put an end to the debate with statistics! 😛
